On Being a
Mathematical Citizen: The Natural
NExT Step
Lynn Arthur Steen, St. Olaf College
The Ninth James R. C. Leitzel Lecture
The Mathematical Association of America
San Jose, California, August 4, 2007
I
am truly honored to join the distinguished list of speakers in this lecture
series dedicated to the memory of my good friend Jim Leitzel. Most of you probably knew Jim through
his leadership of Project NExT.
Before that, Jim chaired many MAA committees dealing with mathematics
education and guided development of A Call for Change, MAA's pioneering recommendations for preparing
teachers of mathematics.
A builder of mathematical communities, Jim was a model mathematical
citizen and my inspiration for this talk.
China, 1983
In
June 1983 my wife and I spent three weeks with Jim and his wife Joan visiting
universities and secondary schools in eastern China. We were part of a delegation of mathematics educators
opening connections five years after the end of the Cultural Revolution when
China was just beginning to awaken from its long national nightmare.
Even
back then Jim worried about preparing teachers. In one conversation after another, he explained to our
Chinese hosts details of a program he had helped develop at Ohio State for
teachers of mathematics who wanted to learn more about the applications of
mathematics to areas such as business, economics, and science.
At
that time the concept of "applications" of the mathematics taught in
school or college caused great confusion among our Chinese translators. For Chinese mathematicians, applied mathematics was a strictly
postgraduate research endeavor.
What
U. S. educators think of as "applications" of secondary or
undergraduate mathematics the Chinese called "practical" or
"popular" mathematics.
They associated these problems—what someone described as
"potted applications"—with the excesses of the Cultural
Revolution when scholars such as Hua Luo-Geng were assigned to teach factory
and farm workers how to solve practical problems.
Jim
spent many patient hours trying to bridge this gulf between our cultures: he listened, learned, engaged, and
encouraged. In thinking about my
topic of being a mathematical citizen, I am reminded of how Jim's efforts to
bridge cultures served as an example for us all.
America,
2007
Today
we are awash in concern about mathematic education. Many of the issues seem little changed from those that
motivated the Ohio State program that Jim Leitzel was explaining 24 years ago
to our Chinese colleagues.
In
addition to worrying about mathematics education, Americans are increasingly
concerned about the overall quality of our educational systems at all
levels. Here's a sample of recent
alarms, ranging from concerns about mathematics in particular, to all STEM disciplines
(science, technology, engineering, mathematics), to the full scope of
education.[1]
·
In Rising Above the
Gathering Storm, the National
Research Council urges increased effort to recruit and enhance the capabilities
of our nation's mathematics and science teachers.[2]
·
Tom Friedman, in The
World is Flat, argues that our
national welfare is threatened by a "numbers gap" in mathematically
trained workers.[3]
·
Dennis Bartels,
executive director of San Francisco's famed Exploratorium, argues in a recent
commentary that our most important priority should be what he calls the
"democratization of scientific knowledge," beginning with the
education of teachers.[4]
·
A recent report from
the Council of Graduate Schools urges doctoral universities "to encourage
scholars to use their knowledge and skills in a real-world setting in service
to community, the state, the nation, and the world."[5]
·
"Recruitment,
retention, renewal" are the three "imperatives" required to
elevate the status of the teaching profession, according to a new report by the
Business-Higher Education Forum (BHEF).[6]
·
The report of the
commission on higher education appointed by Secretary of Education Margaret
Spellings stresses important needs for access, learning, transparency, and
accountability.[7]
My
thesis today is that by virtue of our training, mathematicians have distinctive
habits of mind that can enhance public discussion of public issues. Moreover, and most importantly, we have
a professional obligation to move beyond the boundaries of our own discipline
to bring our special skills of analysis and clarification to bear on important
public policy discussions.
As
evidence for this proposition, I have selected a few current issues in
educational policy and practice that can benefit from mathematicians' insights. By selecting examples from education I
do not mean to imply that education is the only arena that can benefit from
mathematical outreach; it just
happens to be the area I am most familiar with. Others of you may find equally compelling issues in
environmental policy, health insurance, energy resources, or international
relations. Mathematics can
contribute to all these areas, and many more.
I
don’t need to tell you that mathematics is ubiquitous and pervasive. What I would like to convince you is
that to be a mathematical citizen, you need to use your mathematics for more
than mathematics itself.
College
Outcomes
I
begin with something close to all our hearts: undergraduate education. Specifically, how should we measure its
value?
The
increasing cost of higher education, and its increasing importance, has
generated ever increasing calls for greater public accountability. A few years ago assessment guru Peter
Ewell and I wrote a brief survey of this new environment for Focus with the alliterative title "The Four A's:
Accountability, Accreditation, Assessment, and Articulation."[8] One result of this public concern is
the growing influence of (and related controversy about) college ranking
systems such as the U.S. News and World Report. Faculty
and administrators often argue that the work of higher education is too complex
and too varied to be accurately judged by simple output measures. Nonetheless, we live in a world in
which simple measures thrive, whether or not they measure anything important,
or anything at all.
One
could spend a full semester plumbing the depths of the challenge posed by
assessment of higher education.
Here I want to touch on just three particulars to illustrate my argument
about the value of mathematical thinking.
One concerns measures of quantity (graduation rates), another measures
of quality (general education), and a third measures of readiness (alignment).
College
Graduation Rates
The
graduation rate offers a simple measure that is widely accepted as a primary quantitative
yardstick of accountability in higher education—whether of an entire
institution, or of colleges within a university, or of different athletic
teams. The public accepts
graduation rate as a meaningful and relatively reliable indicator of a college's
success because it is a simple ratio that they think they understand, and it
matches student aspirations to earn a degree. Moreover, to those who pay the costs of higher education,
graduation rates seems a good way to hold colleges accountable for educating
those whom they admit.
For
example, Education Trust—a Washington-based educational equity advocacy
group—uses the large variation in graduation rates among otherwise
comparable institutions as evidence that something is fundamentally wrong with
much of higher education. To help
the public judge for themselves, Education Trust has created a web search
engine that makes it easy to compare graduation rates for different
institutions with similar characteristics.[9]
Anyone
who thinks carefully about the definition and calculation of a graduation rate
sees trouble. And mathematicians
are among society's most expert advisors on matters of definition and
calculation.
First,
official graduation rates are based only on students who enter in the fall term
as full time degree-seeking students.
Second, the rate counts as graduates only those who finish at the
institution where they first enroll.
Students who meet these conditions are now a minority in American higher
education.
This
raises an interesting mathematical challenge: how best to define graduation rate?
Alexander
McCormick, Senior Scholar at the
Carnegie Foundation for the Advancement of Teaching, recently proposed
replacing the graduation rate with what he calls a “success
rate"—the proportion of students who, six years after first
entering, have either graduated from college somewhere or are still enrolled
and making progress towards a degree.[10] In his proposal, success is defined as
not dropping out.
Clifford
Adelman, an experienced analyst of education data, argues that the measure of
success should be attainment of a degree, not perpetual enrollment.[11] He proposes to include all entering
students who enroll for more than one course anytime during a twelve-month
academic year and to track rates for four different kinds of students: dependent, traditional age students;
independent adults; transfer-in students; and transfer-out students.
Alexander
Astin, former director of the Higher Education Research Institute at UCLA,
notes that two-thirds of the institutional variation in degree completion is
attributable to differences in characteristics of entering students. Therefore, he suggests, instead of
looking only at graduation rates we should look at the differences between
actual rates and the rate that might be expected based on the kinds of students
a college enrolls.[12]
The definition of
graduation rate is no small matter.
Graduation rates influence the flow of federal and state money to higher
education, students' perception of institutional quality, and the ground rules
for intercollegiate athletics. A
misleading indicator can create significant inefficiency when resources are
withheld from effective programs whose successes are not captured by the
particular definition in use.
Output
Assessments
In
addition to indicators of quantity, parents and taxpayers also want evidence of
quality. The recent report of the
Commission on the Future of Higher Education urges colleges and universities to
measure and report meaningful student learning outcomes.[13] Here "meaningful" refers both
to internal and external objectives that reflect the complex and subtle goals
of higher education while at the same time using a yardstick that the public
can understand and that is relatively consistent.
Several
relatively new instruments have been developed that claim to assess the broad
outcomes of higher education independent of major. These include:
• CAAP: Collegiate Assessment of Academic
Progress (from ACT)[14]
• MAPP:
Measure of Academic Proficiency and Progress (from ETS)[15]
• CLA:
Collegiate Learning Assessment (from Council on Aid to Education)[16]
• NSSE:
National Survey of Student Engagement (from Indiana University)[17]
A
recent study from the University of California raises questions that should
interest a mathematical mind about the potential use of such instruments to
compare colleges.[18]
They found that undergraduates
studying the same disciplines on different campuses have academic experiences
that are more similar to each other than to students studying different
subjects on the same campus.
For
example, students who majored in the social sciences and humanities report
higher levels of satisfaction with their undergraduate education as well as
better skills in critical thinking, communication, cultural appreciation, and
social awareness. But
students majoring in engineering, business, mathematics, and computer science
report more collaborative learning, while those majoring in engineering and
natural science studied much harder than their peers with other majors.
So,
under circumstances in which variation within institutions exceeds variation
across institutions, what mischief might emerge if these instruments are used
to compare institutions? Can one
honestly say that such results are both meaningful and useful for members of
the public? My hunch is that
results from these kinds of assessments will take a lot of careful analysis and
interpretation by people who know how to make and explain fine distinctions.
Alignment
At
the other end of college lie widespread contradictions concerning the
transition from high school to college. In state after state, political and educational
leaders are trying to improve the alignment of their separate educational
systems, especially K-12 with higher education. These efforts, laudable though their intentions may be, face
some significant hurdles.
One
recent study shows that neither admissions nor placement tests in mathematics
give sufficient weight to the higher-level cognitive skills that are critical
to success in college.[19] The same study shows significant
discrepancies between the portfolio of skills assessed in the emerging
state-required high school exit exams and those assessed by mathematics
departments as part of their placement process.
A
related study in California is even more explicit. It shows that many areas of mathematics addressed in
community college placement exams are rarely tested on high school exit exams
because they are thought of as part of middle school mathematics (e.g., whole
numbers, fractions, decimals, percents, tables, graphs).[20]
Another
paradox can be seen in the mathematics scale used by ACT for its widely used
college admissions test. Based on
empirical evidence drawn from nearly one hundred thousand test-takers, ACT
identifies a score of 22 as a "college readiness benchmark" on the
ACT mathematics test indicating that students achieving this score have "a
high probability" of earning a C or higher and a 50/50 chance of earning a
B or higher in college algebra.[21]
Yet the most advanced problems
routinely solved by typical students who score in the range of 20-23
include: solve routine
first-degree equations; multiply
two binomials; exhibit knowledge of slope; evaluate quadratic functions at
integer values. Calculating a slope is one level higher (24-27); solving
quadratic equations is higher still (28-32).[22]
The
chasm between these mathematical skills and those that standards-writers claim
is expected by colleges is striking, and in need of considerable dialogue to
resolve. I suspect that part of
the gap is created by the difference between wish lists of skills that
mathematicians claim are necessary for college success and the reality of many
college programs in which math avoidance is common, anticipated and perhaps
even enabled.
As
you may suspect, I have no intention of answering any of these tough
questions. Indeed, the whole point
of this talk is that working on problems such as these is your job—the next challenge that NExT fellows
should take up—as well as, of course, all other mathematicians. Instead, I want to downshift to a set
of similar challenges at the secondary level. As before, I begin with graduation rates.
High
School Graduation Rates
Until
very recently, the American public tended to think that nearly every American
graduated from high school.
Remember all the excuses in the press twenty years ago about why our
SIMSS and TIMSS scores were lower than other countries? Whereas other nations with higher
twelfth grade scores educated only their elite, U.S. editorialists argued that
we educate everyone.
It
wasn't true then, and is even less true today. In fact, the national on-time high school graduation rate
peaked in 1969 at about 77% and has been falling ever since.[23] It is now apparently, a few points
under 70%. In short, only two out
of three students who begin ninth grade graduate four years later.
I
say "apparently" since graduation rates are not as simple as dividing
one number by another.
As
the Urban Institute once noted, "calculating an apparently simple
value—the percent of students who graduate from high school—is
anything but simple and the best way to go about it is anything but
apparent."[24]
Basic Completion Ratio (BCR):
Numerator:
Total
diplomas awarded in year N.
Denominator: Total 9th grade enrollment in
year N-4.
Adjusted Completion Ratio (ACR):
Numerator:
Total
diplomas awarded in year N.
Denominator: Average enrollment in grades
8, 9 and 10 in year N-4 adjusted to reflect changes in total enrollments in
grade 9-12 between year N-4 and N.
National Center on Educational Statistics (NCES):
Numerator:
Total
diplomas awarded in year N.
Denominator: Total diplomas awarded in
year N plus all students who dropped out during each of the previous four
years.
Longitudinal Graduation Rate (LGR):
Numerator:
Total
diplomas awarded in year N to members of the entering cohort in year N-4.
Denominator: Size of entering cohort in
year N-4 students less those who transferred to another high school or who
died.
Cumulative Promotion Index (CPI):
The
product of the four transition ratios of enrollments in grades 10, 11, 12, and
diploma awards to those in grades 9, 10, 11 and 12, respectively.
Some
Common Formulas for Calculating Graduation Rates[25]
In
contrast to colleges that report data in conformity with federal law in order
for their students to qualify for student aid, in the absence of a federal
standard each state adopted it own definition.
[26] The box above shows several of the
simpler and more common methods;
additional more complicated versions are outlined in a comprehensive
report on graduation rates by the Alliance for Excellence in Education.[27] Not surprisingly, the rates produced by
these different methods vary widely, even with the same data.[28]
Recently
state governors agreed to adopt a single method—the so-called adjusted
cohort graduation rate (ACGR)—that, apart from the adjustments, is
similar to that used by colleges:
divide the number of freshman in one year by the number of graduates
four years later, adjusting for students who transfer in or out.[29]
The result has been a series of headlines warning citizens that many of the
official high school graduation rates are actually lower than had been
previously reported. This makes
officials squirm, but it is a good opportunity for mathematically-minded folks
to help explain why such rates are so complicated.[30]
High
School Mathematics
As
the national push for enhanced STEM education
increases, some are now asking, as a recent headline in Education Week put it, what kind of mathematics really matters?[31] So far, the canonical answer is: the math you'll need for college. That's the way to keep options open. Anything else, people argue,
exemplifies what President Bush calls "the soft bigotry of low
expectations."
In
high school, more advanced tends to mean more abstract, not more
applicable. That's because the
academic curriculum aims at college.
Employers, however, see a frustrating paradox: even though students have studied more mathematics in high
school, they graduate deficient in middle school skills such as percentages,
decimals, and ratios that are prerequisites to successful employment.
Anthony
Carnevale, a labor economist who studies the link between education and jobs,
argues that Algebra II is the "threshold course"—the high
school course that most clearly distinguishes those who go on to jobs with high
earning trajectories from those who do not.[32] Because of the power of this argument,
enrollments in Algebra II have more than doubled in the last decade and roughly two-thirds of the states
now require Algebra II for graduation.
But
scores on the 12th grade NAEP mathematics test have hardly budged during this
same period.[33], [34] Neither has there been a dramatic
decline in the need for remediation in college mathematics. Moreover, according to a recent article
in Science, the proportion of
underrepresented minorities that demonstrate proficiency on the NAEP
mathematics tests has slipped in each ethnic group.[35]
So
if neither employers nor academics see noticeable results from the
significantly greater emphasis on Algebra II, what's wrong?
Educational
philosopher Nel Noddings suggests that the problem is a proliferation of what
she calls fake academic courses:
no proofs, no word problems, no brain teasers, no arguments—only a
steady routine of drill on the discrete skills enumerated in the frameworks for
state tests. "I've observed such classes," she writes. "They have pseudo-algebra and
pseudo- geometry. This is pedagogical fraud, and students are doubly
cheated: they do poorly in the
required courses and they are deprived of courses in which they might have done
well."[36]
Noddings
argument is that in the interest of high expectations—where high equates
with academic—schools have dropped low-status practical courses. But then to help their students pass
state exams in the newly required academic courses, they eviscerated their
intellectual content.
In
other words, people argued that applied courses have no intellectual content,
so everyone should take academic courses.
As a consequence, many of these courses have lost their intellectual content. We've downshifted from cookbook calculus to automated
algebra where
over-emphasis
on lists of learning objectives promote shallow learning and swift forgetting.
Social
scientists call this Campbell's law—a kind of uncertainty principle for
public policy enunciated in 1976 by social psychologist Donald Campbell:
The more any quantitative social indicator is used
for social decision-making, the more subject it will be to corruption pressures
and the more apt it will be to distort and corrupt the social processes it is
intended to monitor.[37]
In education, I think
of this more as a Perversity Principle:
the more importance we place on specific results, the less likely they
will be achieved as we intend.
Proficiency Counts
A
good example of the Perversity Principle is the effect on education of the way
schools are judged under the NCLB law:
by the percent of students who are proficient. A few months ago the Washington Post quoted a middle
school teacher as reporting "We were told to cross off the kids who would
never pass. We were told to cross off the kids who, if we handed them the test
tomorrow, would pass. And then the kids who were left over, those were the kids
we were supposed to focus on."[38]
Two
economists at the University of Chicago used data from the Chicago Public
Schools to test whether this teacher's comment described typical behavior. They used data from dozens of schools
in Chicago to test the hypothesis that when proficiency counts are used as the
primary standard for judgment, teachers gradually focus most of their effort on
students near the middle of the achievement spectrum, to the neglect of those
at either end.
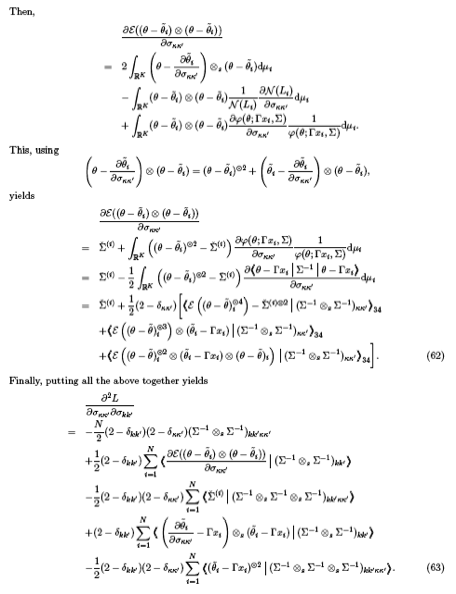
Impact of Proficiency Tests on Sixth Grade Mathematics
Achievement
The
increase in average grade level in relation to achievement score percentiles
after two years of instruction under a proficiency count regime
Empirical
data from Chicago conform to the predictions of this model.[39] Usually graphs of learning growth are
slightly exponential: the more you
know, the more you learn. But the
graph of learning growth after two years of assessment under a system of
proficiency counts looks like an upside down U: the most learning took place for kids in the middle the
knowledge spectrum, the least for kids at each end:
Variation in
Standards
Our
system of local control of education not only permits states to define
graduation rates any way they please, but also to set standards for high school
graduation at any level they please.
The
No Child Left Behind law—President Bush's signature effort to both raise
and equalize educational accomplishment—required each state to report
publicly on the percentage of students in different categories who are proficient
according to the state's own standards.
The law contains significant penalties for schools that do not make
adequate yearly progress towards these goals.
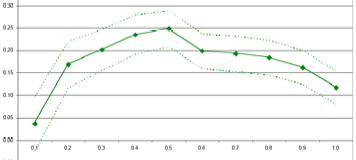
But
to accommodate our tradition of local control, each state remained free to set
its own level of proficiency. When
researchers matched states' proficiency reports against those of the randomized
National Assessment of Educational Progress (NAEP), they found (a) great
variation in the definitions of proficiency among the states and (b) a strong
negative correlation (.83) between the percent of students deemed proficient
and the level of accomplishment that the state required for proficiency.[40] Indeed, what many states call
"proficient" is closer to what the national test rates as merely
"basic." The
differences between state proficiency standards were sometimes more than double
the national gap between minority and white students.
State vs. National
Proficiency Levels for 8th Grade Mathematics
One
consequence is that a child who is considered to be proficient in one state
(Connecticut, for example) may fall far short of expectations if the family
moves across state lines (say, to Massachusetts). Some now argue that this data demonstrates the need
for national standards; Indeed, early this year Senator Christopher Dodd (D-CT)
and Representative Vern Ehlers (R-MI) introduced a bill to create and implement
voluntary national standards in mathematics and science by synthesizing
existing national standards.[41] Not surprisingly, representatives of
state governments oppose this move.[42] (Many mathematicians will
recall similar arguments a decade or more ago during a failed effort to produce
a voluntary national assessment of 8th grade mathematics.)
Would
mathematicians produce standards with such huge variation from state to
state? I rather doubt it. As mathematical citizens, MAA members
and NExT alumni should be active participants in setting these state
proficiency levels, as well as in debating the pros and cons of national
standards. I'm sure that's what
Jim Leitzel would be doing.
Determining
Proficiency
Partly
because of the public scrutiny over whether or not schools are making adequate
yearly progress under the NCLB law, and also because in some states too many
students are failing tests required for graduation, one state after another is
arguing over the passing scores that determine whether or not a student can
graduate.[43]
For
example, parents in Washington state were upset because too many students
failed the state exams. So they
hired a consultant who just reported that the tests, and the standards on which
they were based, were not too hard but too lax![44]
People
think state tests are scored like the tests they took when they were in
school: your score is the total of
all points earned on all the items that you answered correctly. Few know just how misleading this image
is.
A
few years ago Alan Tucker (of SUNY-Stony Brook) got involved in this debate
when he was appointed to a commission in New York to investigate why so many students
failed the 2003 Math A Regents test.
His eyes were opened, and he wrote several papers about what he learned
from this experience.[45],
[46] The summary below is based on these
papers.
Item
Response Theory
Scoring
of state tests is based on a psychometric methodology called Item Response
Theory[47]
whose purpose is to maintain a constant performance standard from year to
year. It was errors in the
application of this methodology that created the mess in New York: The commission on which Alan served concluded
that the passing score of 51 that was used on the 2003 test should actually
have been about 30. Quite a
difference!
Item
Response Theory relies on two major (and highly questionable) assumptions:
• First,
that the mathematical ability of students and the difficulty of test items can
be placed on a common one-dimensional scale.
• Second,
that for each item the probability of a correct answer for a student of ability
x is given by a family of item
response curves that is controlled
by a small number of parameters.
A
typical family of item response curves is give by the probability function pα, β(x) = 1/(1+e-α(x-β)) where α is a scale parameter that
controls the slope of the response curve and β corresponds to the
difficulty level of the item.
(Each such curve is shaped like a lazy "S" with inflection
point at x = β corresponding to p = ½. Some versions of item response theory use additional
parameters.)
Assessment
using IRT is a two stage process:
first set a performance standard, and then score tests in relation to
this standard. The catch is that
each item on a test has a different performance characteristic that is
supposedly reflected by its item response curve.
To
set the performance standard, a sample of questions is given to a sample of
students and then ranked by the percentage of students getting them right. Then a committee of teachers or other
experts reviews the ranked list of questions, seeking to bookmark items that
mark the boundary of each performance level (e.g., "advanced,"
"proficient," or "basic"). In one version of this process, the bookmark is
supposed to be the hardest item that 2/3rds of those who meet the desired
performance standard would get right.
Values
of the item response curve parameters α and β are determined from
field test data. The resulting
curve is then "read backwards" to determine the ability level of a
hypothetical student who is will get the bookmarked items correct with
probability 2/3. Then the
performance standard for the test—the so-called "cut
score"—becomes the expected score of a student at this (marginal)
ability level, that is, the sum of the expected number of points earned on each
test item according to the item response curve of each item.
Policy
Concerns
As
we have seen, performance standards vary greatly from state to state. The IRT process may well be one of the
reasons. Certainly, there are many
opportunities for arbitrariness.
Some of those identified by Alan in his analysis include:
• The
process that matches bookmark items to proficiency standards is quite
subjective.
• Student
performance varies unpredictably depending on which items they have practiced.
(For this reason, teachers' judgment of item difficulties is frequently
inconsistent with student performance.)
• The
assumption that student abilities and item difficulties can be placed on the
same scale is highly simplistic.
• Items
designed to assess understanding and creative problem solving generate relatively
unreliable psychometric statistics, which leads test developers to favor more
routine questions.
• Field
test data fit item response curves too imperfectly to determine item parameters
and cut scores with a high degree of accuracy.
• Different
vendors use slightly different versions of IRT theories (e.g., response curves
with three rather than two parameters).
One
conclusion is that passing scores on standards-based tests are very unlikely to
be comparable at a level of precision that justifies high-stakes consequences.
Another is that the very theory underlying this
testing protocol biases tests against the sort of mathematical reasoning that a
high-quality K-12 mathematical education should develop in future
citizens. The more the
questions probe complex thought, the less well the scoring theory fits the
student performance data and "the more likely it is that equating methods
will misperform."[48]
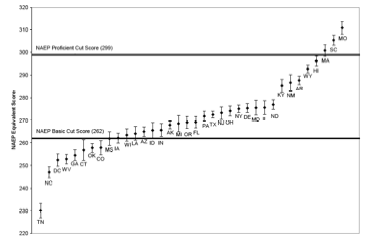
As
evidence of the need for mathematicians to lend their minds to this kind of
policy debate, I display in Appendix A one page from a recent research paper
whose purpose is to enhance the ability of item response theory to produce
estimates of individual performance from matrix-designed assessments (such as
NAEP).[49]
Liberal Learning
So
far all my examples could be thought of as variations on a theme of putting
mathematics to use in the particular sphere of education policy, that is, of
fulfilling one part of the challenge posed by the Council on Graduate Education
to encourage scholars to use their knowledge and skills "in service to
community, the state, the nation, and the world."
I
close by calling your attention to a brand new report that poses a different
kind of challenge. It is Beyond
the Basics: Achieving a Liberal
Education for All Children, edited
by Chester Finn, president of the Thomas B. Fordham Foundation and Diane
Ravitch, a former Assistant Secretary of Education.[50]
For
those who do not follow such things, I should mention that Finn and Ravitch and
the Fordham Foundation have been among the most forceful advocates for
aggressive state standards monitored by high stakes assessments. Fordham publishes biannual reports
grading state standards, and very few get above a C.
Finn
and Ravitch, it seems, have just discovered the Perversity Principle. It turns out that if you test only
reading and mathematics, only reading and mathematics get taught. I quote (with slight paraphrasing) from
their introduction:
Pressure to pass basic skills tests leads
teachers—often against their better judgment—to substitute “drill
and kill” for “problem solving” … .
“Rich content” doesn’t have many forms of self-defense, not in the face
of external demands to hoist more kids over a specific bar to be determined by
their scores on standardized tests. …
We should have seen this coming. We and others who have pressed for
higher academic standards in recent years … should have anticipated … that more
emphasis on some things would inevitably mean less attention to others. …
We were wrong.
We didn’t see how completely standards-based reform would turn into a
basic-skills testing frenzy or the negative impact that it would have on
educational quality. …
Those who see K-12 education as the solution to
[shortages of STEM workers] are pointing America toward yet another round of
unintended consequences: STEMs
without flowers.
Too much STEM may mean too few leaves and
flowers. If children are deprived
of the full richness of liberal education, they will face unmanageable
challenges on many fronts:
• The
gradual death of liberal learning in higher education.
• An
accountability movement increasingly focused only on “basic skills.”
• Growing
support for math and science at the expense of the rest of the curriculum.
• Widening
gaps and accelerating advantage of the have-a-lots over the have-littles.
If this dire scenario plays out, the American vision
of a democratic education system nourishing a democratic society will perish.
Finn
and Ravitch's call for putting the flowers back on the STEMs is also a dialogue
in which mathematicians should participate—not by applying mathematics, but by unfolding mathematics as part of, rather than in opposition
to, the goals of liberal education.
Many whose own mathematics education never revealed this face of
mathematics have a hard time seeing our discipline that way. It is out responsibility to help them
do so now.
If
Jim were here I'm sure he would eagerly take up this new challenge as a natural
extension of that long ago dialogue in China about the nature and role of
applications in teacher education.
STEM with flowers offers
an excellent opportunity to engage the world as mathematical citizens.
Appendix
One page from Tamás Antal's 18 page report "On the
Latent Regression Model of Item Response Theory" (ETS Research Report, RR-07-12,
March, 2007).